All posts in Bankruptcy Data

March 14, 2014 – LAFBA – STATE OF THE CIRCUIT/DISTRICT

STATE OF THE CIRCUIT/DISTRICT

March 14, 2014 – 12:00 p.m. (Registration at 11:30 a.m.)

Location: Doubletree Hotel (formerly Kyoto Grand) (120 S. Los Angeles St., Los Angeles, CA 90012)

Featuring:
Judge Paul J. Watford
United States Court of Appeals, 9th Circuit
Chief Judge George H. King
United States District Court, Central District
Chief Magistrate Judge Suzanne H. Segal
United States District Court, Central District
Chief Bankruptcy Judge Peter H. Carroll
United States Bankruptcy Court, Central District

December 13, 2013 – FBA-LA 10th Annual Bankruptcy Ethics Symposium and Bias/Substance Abuse MCLE bonus session

10TH ANNUAL BANKRUPTCY ETHICS SYMPOSIUM
December 13, 2013 – 9:00 a.m. (Registration at 8:30 a.m.)
Location: Roybal Federal Building, Conference Room 283 (255 E. Temple St, Los Angeles, CA 90017)

TOPICS:
9:00 a.m. – 12:45 p.m.

Pre-Bankruptcy Planning: 20 Shades of Gray
Technology Tips and Trap Doors
An Ethics Conversation with Evan Jenness

1:00 p.m. – 3:00 p.m. – Afternoon Presentation (Optional)
Substance Abuse – Elimination of Bias

SPEAKERS:
Hon. Ernest M. Robles, United States Bankruptcy Court
Hon. Deborah J. Saltzman, United States Bankruptcy Court
Gillian N. Brown, Esq., Pachulski Stang Ziehl & Jones LLP
J. Scott Bovitz, Esq., Bovitz & Spitzer
M. Erik Clark, Esq., Borowitz & Clark, LLP
Christie L. Cronenweth, Esq., Law Offices of Christie Cronenweth
Evan A. Jenness, Esq., Law Offices of Evan A. Jenness
Stella A. Havkin, Esq., Havkin & Shrago
David A. Tilem, Esq., Law Offices of David A Tilem

MCLE: 3.5 Hours General MCLE; 1Hr. Substance Abuse; 1 Hr. Elimination of Bias. This activity has been approved for Minimum Continuing Legal Education Credit by the State Bar of California. The FBA certifies that this activity conforms to the standards of approved education activities prescribed by the rules and regulations of the State Bar of California governing minimum continuing legal education.

Filings in February 21% Below Last Year but 5% More than January

2007      2008     2009     2010    2011    2012    2013
Jan 55,200 70,300 89,000 102,600 102,200 87,900 -14% 78,500 -11%
Feb 58,800 79,500 102,000 117,800 109,600 104,400 -5% 82,300 -21%
March 73,100 90,400 131,000 159,200 146,400 122,100 -17%
April 67,800 93,200 128,700 146,200 129,800 108,900 -16%
May 69,900 89,700 120,400 133,500 122,800 109,300 -11%
June 67,300 89,900 124,800 133,850 120,700 99,047 -18%
July 69,100 96,400 130,500 134,600 110,200 97,083 -12%
Aug 77,100 94,300 120,000 135,600 120,900 104,300 -14%
Sept 67,500 96,200 125,500 134,000 110,400 87,500 -21%
Oct 81,200 108,900 130,200 129,700 111,500 101,300 -9%
Nov 74,200 91,400 115,500 118,100 98,500 86,800 -12%
Dec 65,900 95,900 117,000 114,700 96,500 75,600 -22%
827,100 ####### 1,434,600 1,559,850 1,379,500 1,184,230 -14%

Central District Filings Down

Central District of California
   2008    2009    2010    2011    2012    2013
Jan 3,694 6,004 9,013 10,868 8,835 -19% 6,552 -26%
Feb 3,787 6,971 9,659 10,631 9,307 -12%
March 4,381 8,529 12,840 13,543 10,108 -25%
April 5,023 8,512 12,114 12,087 9,034 -25%
May 5,177 8,967 11,906 11,669 9,620 -18%
June 5,351 9,595 12,190 11,718 8,165 -30%
July 5,983 9,894 12,737 10,418 8,201 -21%
Aug 6,195 9,748 12,720 11,496 8,779 -24%
Sept 6,290 9,214 12,412 10,006 7,222 -28%
Oct 6,364 10,322 11,753 9,887 8,438 -15%
Nov 6,029 9,462 10,900 9,099 7,192 -21%
Dec 6,615 9,864 10,925 9,089 6,187 -32%
64,889 107,082 139,169 130,511 101,088 -23%
% of total 0.059 0.075 0.089 0.095 0.852

January, 2013 Filings Down 11% From Year Ago

2007    2008    2009    2010    2011    2012    2013
Jan 55,200 70,300 89,000 102,600 102,200 87,900 -14% 78,500 -11%
Feb 58,800 79,500 102,000 117,800 109,600 104,400 -5%
March 73,100 90,400 131,000 159,200 146,400 122,100 -17%
April 67,800 93,200 128,700 146,200 129,800 108,900 -16%
May 69,900 89,700 120,400 133,500 122,800 109,300 -11%
June 67,300 89,900 124,800 133,850 120,700 99,047 -18%
July 69,100 96,400 130,500 134,600 110,200 97,083 -12%
Aug 77,100 94,300 120,000 135,600 120,900 104,300 -14%
Sept 67,500 96,200 125,500 134,000 110,400 87,500 -21%
Oct 81,200 108,900 130,200 129,700 111,500 101,300 -9%
Nov 74,200 91,400 115,500 118,100 98,500 86,800 -12%
Dec 65,900 95,900 117,000 114,700 96,500 75,600 -22%
827,100 1,096,100 1,434,600 1,559,850 1,379,500 1,184,230 -14%

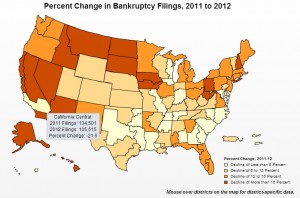
Decline in Filing Rates in 2012 by District

Here is an interactive map showing the percent decline in filing rates by district. 

Local Filings Down 32% in December

Central District of California
   2008    2009    2010    %    2011    2012
Jan 3,694 6,004 9,013 50% 10,868 21% 8,835 -19%
Feb 3,787 6,971 9,659 39% 10,631 10% 9,307 -12%
March 4,381 8,529 12,840 51% 13,543 5% 10,108 -25%
April 5,023 8,512 12,114 42% 12,087 0% 9,034 -25%
May 5,177 8,967 11,906 33% 11,669 -2% 9,620 -18%
June 5,351 9,595 12,190 27% 11,718 -4% 8,165 -30%
July 5,983 9,894 12,737 29% 10,418 -18% 8,201 -21%
Aug 6,195 9,748 12,720 30% 11,496 -10% 8,779 -24%
Sept 6,290 9,214 12,412 35% 10,006 -19% 7,222 -28%
Oct 6,364 10,322 11,753 14% 9,887 -16% 8,438 -15%
Nov 6,029 9,462 10,900 15% 9,099 -17% 7,192 -21%
Dec 6,615 9,864 10,925 11% 9,089 -17% 6,187 -32%
64,889 107,082 139,169 30% 130,511 -6% 101,088 -23%
% of total 0.059 0.075 0.089 0.095 0.852

Filings End the Year With a Thud

2007    2008    2009    2010    %    2011    %     2012
Jan 55,200 70,300 89,000 102,600 15% 102,200 0% 87,900 -14%
Feb 58,800 79,500 102,000 117,800 15% 109,600 -7% 104,400 -5%
March 73,100 90,400 131,000 159,200 22% 146,400 -8% 122,100 -17%
April 67,800 93,200 128,700 146,200 14% 129,800 -11% 108,900 -16%
May 69,900 89,700 120,400 133,500 11% 122,800 -8% 109,300 -11%
June 67,300 89,900 124,800 133,850 7% 120,700 -10% 99,047 -18%
July 69,100 96,400 130,500 134,600 3% 110,200 -18% 97,083 -12%
Aug 77,100 94,300 120,000 135,600 13% 120,900 -11% 104,300 -14%
Sept 67,500 96,200 125,500 134,000 7% 110,400 -18% 87,500 -21%
Oct 81,200 108,900 130,200 129,700 0% 111,500 -14% 101,300 -9%
Nov 74,200 91,400 115,500 118,100 2% 98,500 -17% 86,800 -12%
Dec 65,900 95,900 117,000 114,700 -2% 96,500 -16% 75,600 -22%
827,100 1,096,100 1,434,600 1,559,850 9% 1,379,500 -12% 1,184,230 -14%

Local Filings Down Again in November 2012

Bankruptcy filings in the Central District in November fell 21% over last year and 15% compared to last month.

Central District of California
2008 2009 2010 % 2011 2012
Jan 3,694 6,004 9,013 50% 10,868 21% 8,835 -19%
Feb 3,787 6,971 9,659 39% 10,631 10% 9,307 -12%
March 4,381 8,529 12,840 51% 13,543 5% 10,108 -25%
April 5,023 8,512 12,114 42% 12,087 0% 9,034 -25%
May 5,177 8,967 11,906 33% 11,669 -2% 9,620 -18%
June 5,351 9,595 12,190 27% 11,718 -4% 8,165 -30%
July 5,983 9,894 12,737 29% 10,418 -18% 8,201 -21%
Aug 6,195 9,748 12,720 30% 11,496 -10% 8,779 -24%
Sept 6,290 9,214 12,412 35% 10,006 -19% 7,222 -28%
Oct 6,364 10,322 11,753 14% 9,887 -16% 8,438 -15%
Nov 6,029 9,462 10,900 15% 9,099 -17% 7,192 -21%
Dec 6,615 9,864 10,925 11% 9,089 -17%
64,889 107,082 139,169 30% 130,511 -6%
% of total 0.059 0.075 0.089 0.095 0.852


Central District Bankruptcy Filings Compared to New York and Texas

Total bankruptcy filings in the Central District of Cal in November 2012:  7,192

Total bankruptcy filings in November, 2012 for New York AND Texas: 6,576

TXEB 525
TXNB 1333
TXSB 1094
TXWB 892
NYEB 1029
NYNB 641
NYSB 664
NYWB 398
6576